
Geodaisy® is more than just a way of receiving your monitoring data and raising alarms.
It provides you with the ability to create your own graphs and store them in your own space so that they automatically update with new data when it becomes available. No more downloading data for inclusion in a spreadsheet. Geodaisy® keeps your graphs and real-time data safe in the same place and accessible from any internet connection through your own secure login.
secure login
Access Geodaisy® through a secure password protected login page, unique to you.
Document storage
All of your important monitoring documents such as the monitoring specification, design statements, instrument datasheets and calibration certificates are stored with the project for easy access. Photographs and other scanned images can also be stored with a project.

Interactive maps and views
The basic presentation for your monitoring data is through an interactive map or view (e.g. a drawing or a photograph) of your site.

Each instrument is represented by symbol which is clearly coloured according to the ALARM status of the instrument and can have annotations added to indicate the direction of the movement. Hovering over a symbol shows a box with the timestamp of the latest readings that are coloured according the the ALARM status at each elevation and from where important sensor documents such as calibration sheets and instrument datasheets can be accessed. Trend plots can be created showing the displacements at chosen elevations. Profile plots can be accessed for cumulative and incremental deviations and displacements. All plots can include ALARM thresholds, construction information and data can be modelled using a range of curve fitting tools. Maps can also include links to other views, discrete graphs and web pages.
Contours and sections
Maps can contain contoured areas and sensor data can be projected onto interactively defined sections that can then be saved as graphs that will update as new data is added to the system.

edit graphs and save them to your own space
All graphs can be edited by you and saved to your own space leaving the original graph unchanged. Once saved your graphs will be updated in real-time with the latest data and can be accessed by you and shared with other people.

Editing options include changes to the scales, inclusion of your own title blocks, images and logos, changes to the visible datasets including line styles, symbols and adjustments such as bias corrections for probe inclinometers, the addition of geological logs, annotations and curve fitting tools.
Add important construction information
Construction progress such as the depth of excavation adjacent to a retaining wall can be added and tagged to the displacement profiles. The reference end can be independently set for each displacement profile and linked to survey data where translation is detected.
The graph above shows measurements from a retaining wall where construction started with displacements referenced to the bottom of the instrument and then changed to the top of the instrument when the top slab was added.
Convergence graphs for tunnels
For ShapeArrays placed in tunnels the reference point can be independently chosen to suit the mechanism of displacement and any number of points can be selected for the calculation of convergence. Alarms can be raised against a convergence.

Intelligent alarming
There is no limit to the number of thresholds that can be defined. The system can issue alarms when a threshold is crossed. It can also issue warnings when the data departs from a threshold after having been at or around a threshold for a while and it can provide estimates of when another threshold is likely to be reached based on a predictive algorithm. Alarms can be issued with tasks to be completed and the system can track the progress of these tasks and continue to issue alarms and warnings until a task has been closed out.

TABLES
Data can be presented in tables with clear indications of the current status and information on the maximum/minimum conditions and when they occurred. Tables are updated after each data call.

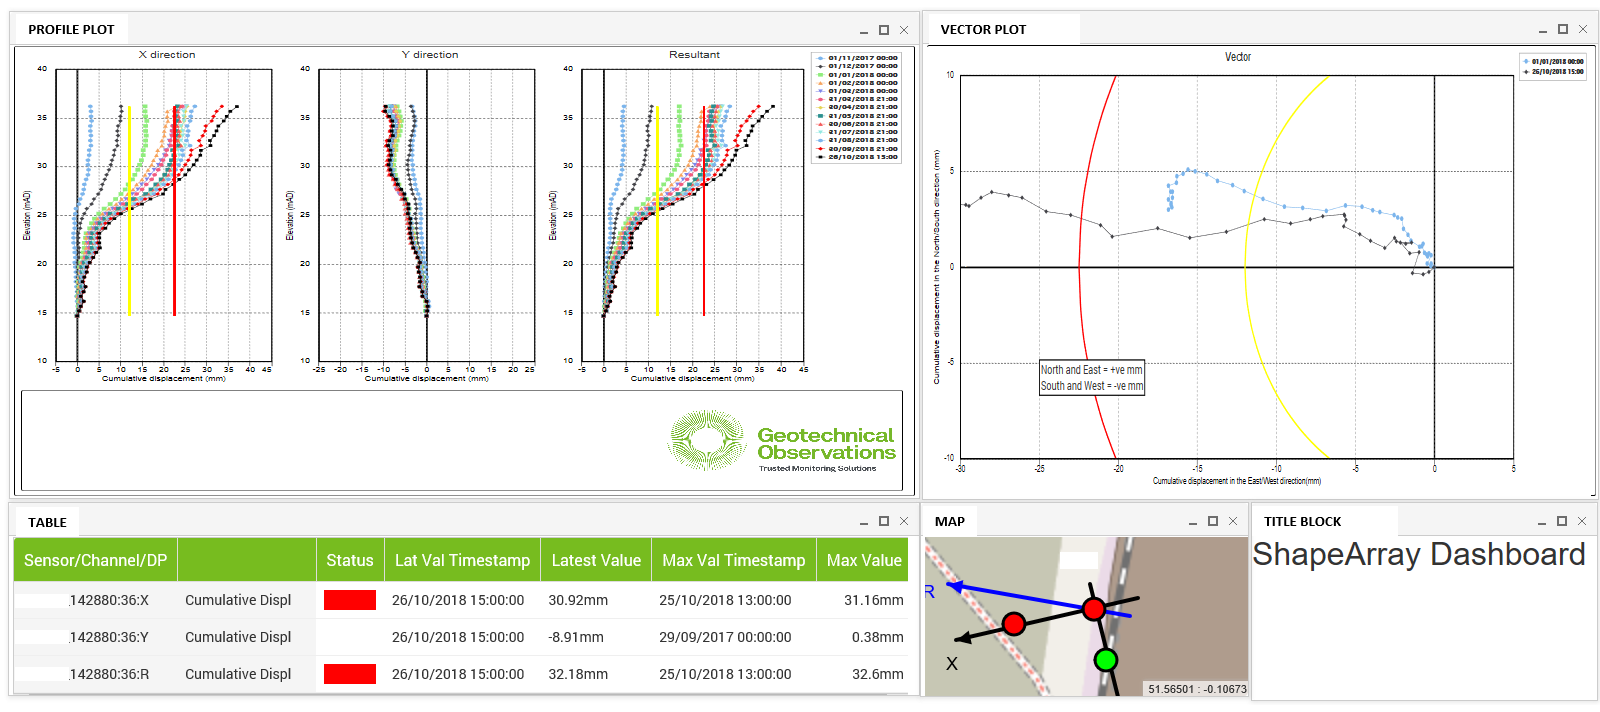
Dashboards
Users can create mixed content dashboards with information that is relevant to their work or a specific part of their project. Once created these can be saved for future use and will update with the latest measurements as they become available. Each part of a dashboard works interactively and can be maximised for ease of use.
Reports
Reports can be issued for immediate (one-off) use or re-issued to defined schedules and frequencies. Reports can also be automatically issued to multiple people or groups of people and at different schedules to different groups, which is particularly useful when a project has multiple shift patterns.
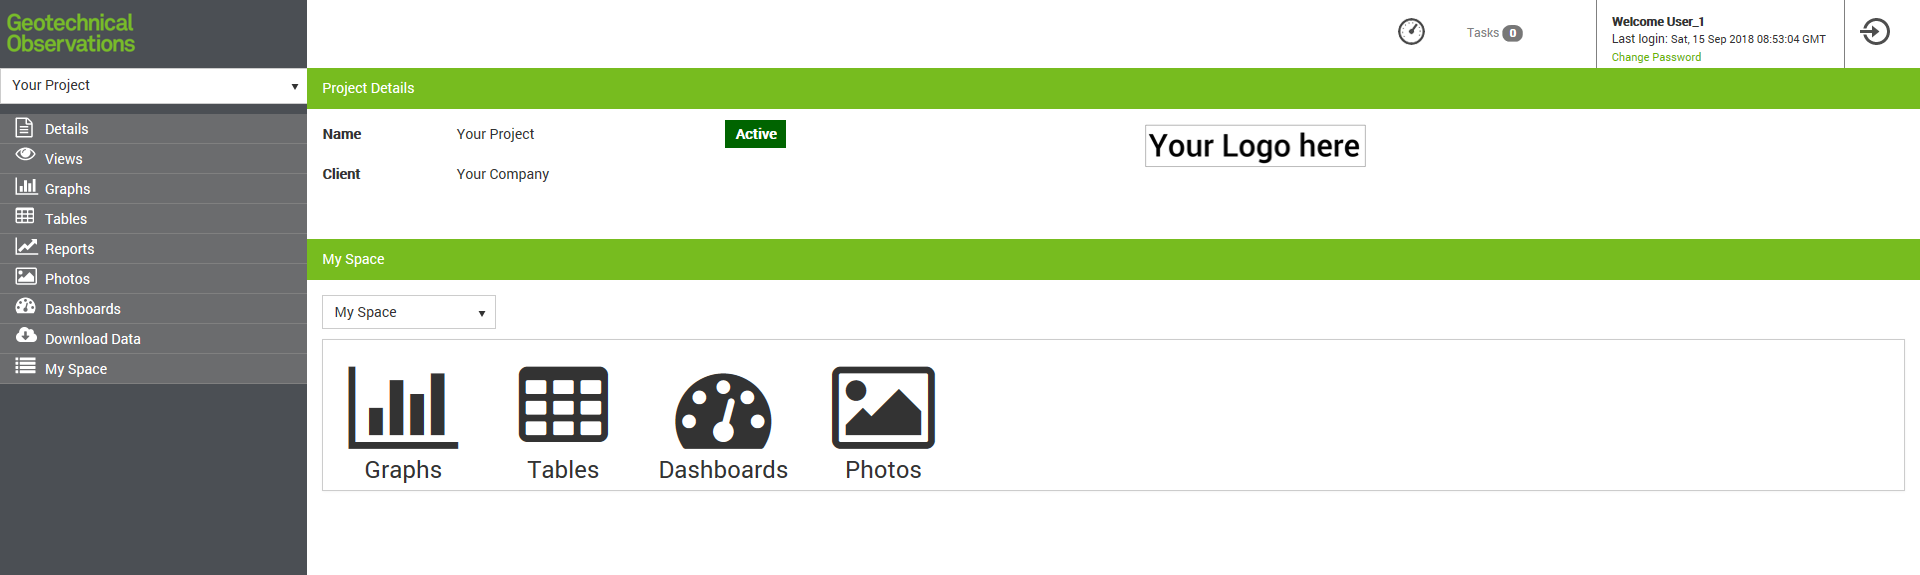
A personal system, how you want it to look
Each graph, table and dashboard that you create can be saved to your own personal space on the system and will update with the latest measurements as they become available. You can choose who you want to share your content with and you can see other User's content on the same project if they choose to share it with you. The System graphs, tables, dashboards and reports are unaffected by any changes that User's make to their own content.
Geodaisy® has the power of a database and the flexibility of a spreadsheet all from the comfort of an online environment. It will help you to make quick and informed decisions.
To find out more about our measurements use the following links:
— Wireless